Sentor AI
AI review analysis & entity-level insights platform
Project Overview
Sentor is a web-based SaaS platform that turns scattered customer feedback into structured, entity-level insights.
Teams bring in reviews from platforms such as Airbnb, Trustpilot, Google Maps, App Store and G2, or upload their own files. Sentor then classifies every input on a 5-point sentiment scale against the topics each team chooses to track.
But the challenge wasn't simply showing sentiment scores on a dashboard.
The real challenge was designing how users move from raw, unstructured text to an insight they can actually act on, without losing control of their data along the way.
I designed the core Sentor workflows for review analysis, entity-level insights and data visualization across complex dashboards, and redesigned the Sentor Drive file-management experience.
Project Info
Project Type
AI-powered feedback & review sentiment analysis platform
Category
B2B SaaS · AI / NLP · Data Visualization
PLATFORM
Responsive Web App (Dashboard + Developer API)
My Role
Product Designer Responsible for review-analysis workflows, entity-level insights, data visualization, dashboard design and the Sentor Drive file-management experience.
Timeline
~1 Year
From Raw Feedback,
to Actionable Insight
At first glance, Sentor could look like a simple sentiment tool: paste text, get a positive or negative score.
But the real workflow is more complex. A user may need to:
01. Connect a review platform or upload their own files
02. Define what they actually want to track
03. Wait while AI processes large volumes of text
04. Understand sentiment at the level of specific topics, not just overall
05. Filter, compare and explore results over time
06. Decide which data should and shouldn't be part of the analysis
07. Manage plan limits, sources and files as the project grows
08. Access the same intelligence through an API
Three Challenges
Shaped the Experience
COMPLEXITY
Review data comes from many platforms and file formats. Presented without structure, it quickly becomes overwhelming.
TRUST
AI analysis is asynchronous and invisible. Users need to understand what is being analyzed, what is still processing and what their results are based on.
CONTROL
As projects grow, users need to shape their dataset, keeping some files in the analysis and leaving others out, without destroying their work.
Designing One Analysis Experience Around Multiple Systems
The biggest design challenge wasn't a single chart or screen. It was defining how sources, files, AI processing and insights should work together as one product.
Sentor combines five systems:
01 — Sources: platform importers, custom URLs, uploads and pasted text bring feedback in.
02 — Data Control: Sentor Drive and per-project include/exclude decide what is analyzed.
03 — AI Analysis: every input is classified on a 5-point sentiment scale against tracked entities.
04 — Insights: the feed, trends, distributions, clusters and narrative summaries turn scores into meaning.
05 — Access & Plans: usage limits, billing and the developer API make the same intelligence available at scale.
Information Architecture
The product separates two levels:
what belongs to the account (projects, files, settings) and what happens inside a project (data in, analysis, insight out).
Projects & Usage
All projects in one table, with plan limits for projects, reports and API calls always in view.
Files, Stored Once
An account-level home for every file. Upload once, then reuse it across any project.
Access & Control
API keys and rate limits, developer resources, billing, notifications and support.
Sources & Files
Platform importers, custom URLs, uploads and pasted text.
Include / Exclude
A checkbox per file and source decides what is analyzed.
No delete neededAI Analysis
Every input classified on a 5-point sentiment scale per entity.
Insights
Sentiment feed, trends, topic clusters and a written summary.
Separate data storage from data analysis. A file is an asset; including it in a project is a choice. Every insight traces back to a dataset the user chose.
From Architecture to User Flows
The architecture defined how data is structured. The following flows define how users create, feed and explore that structure.
Project Setup
Data Ingestion
AI Processing
Insight Exploration
Data Control
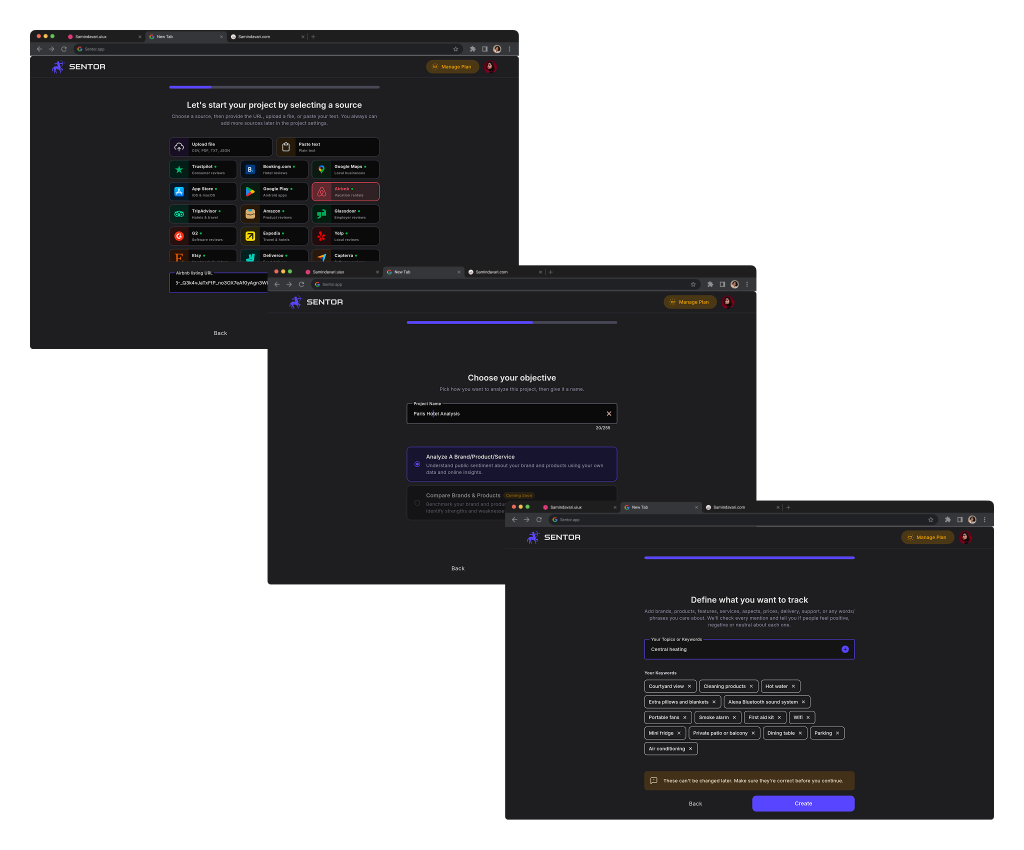
Guided Project Creation
A 3-step wizard that turns a blank project into a configured analysis.
Select a Source: pre-built platform cards (Upload File, Paste Text, Trustpilot, Google Maps, Airbnb, App Store, Google Play, Amazon, Glassdoor, G2, Capterra) plus a custom URL field. A note reassures users they can add more sources later in project settings.
Choose Your Objective: project name, language, and analysis type. Analyze a Brand/Product/Service is active; Compare Brands & Products is shown as Coming Soon to signal the roadmap without blocking the flow.
Define What You Want to Track: a topic/category plus editable keyword pills (e.g. Room Quality, Cleanliness, Staff & Service, Check-in, Location, Price / Value). An inline warning asks users to double-check similar or overlapping topics before creating the project.
Design intent:
distribute setup into small decisions, and make entity definition explicit, because entities shape every insight that follows.
Project Workspace
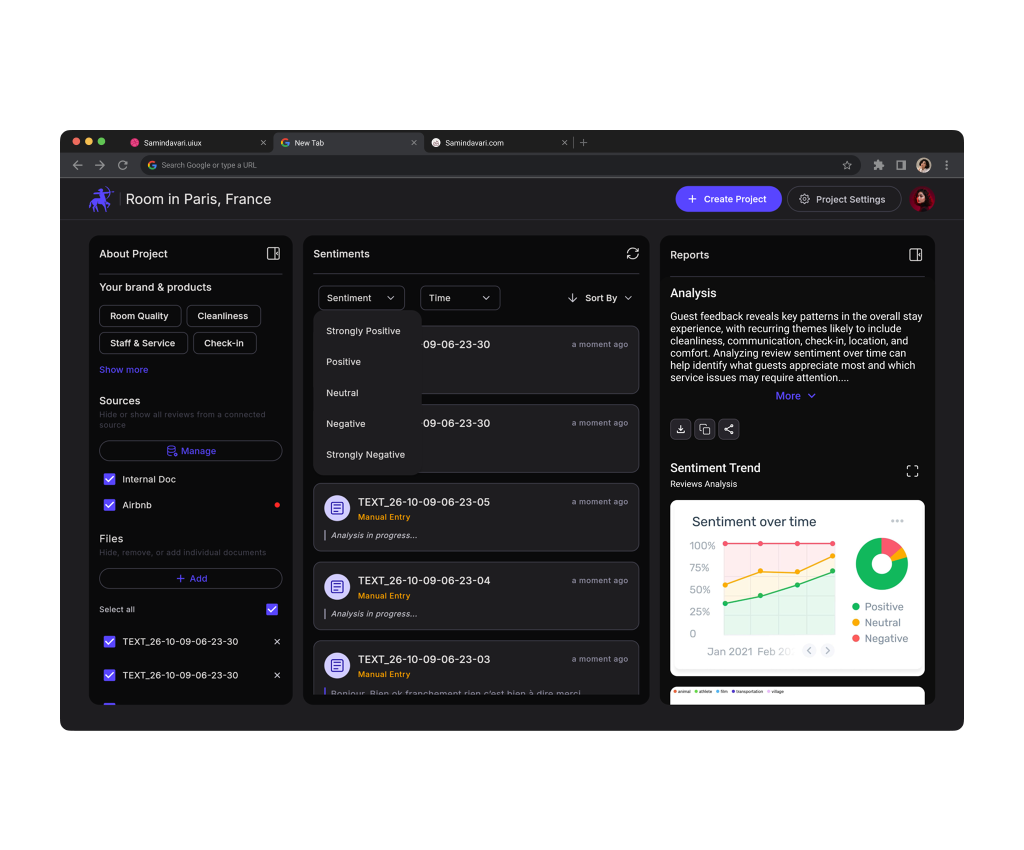
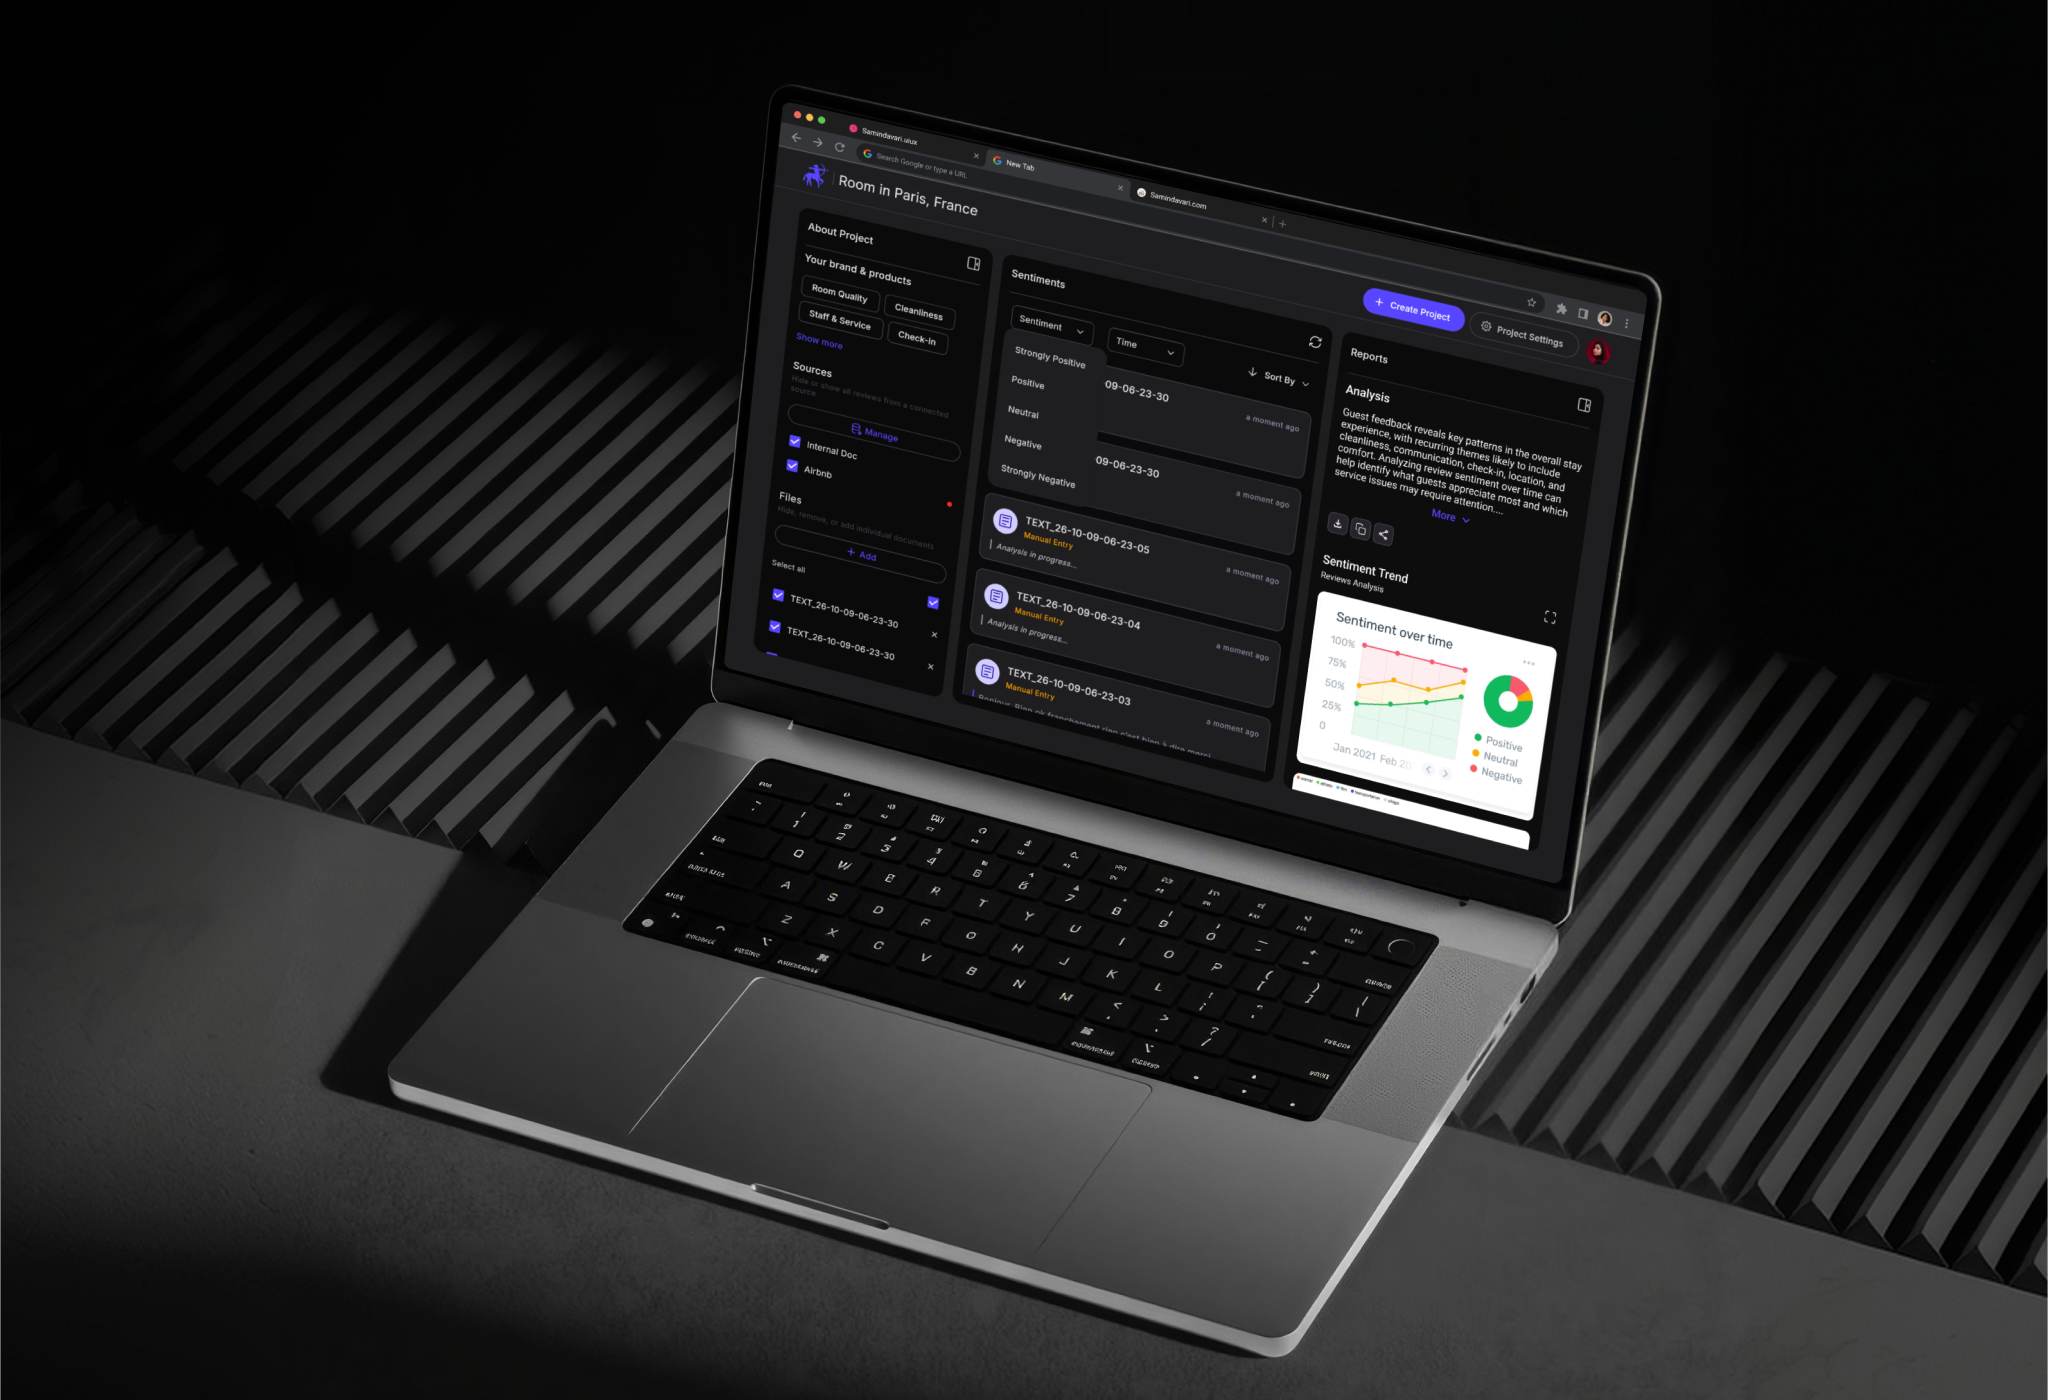
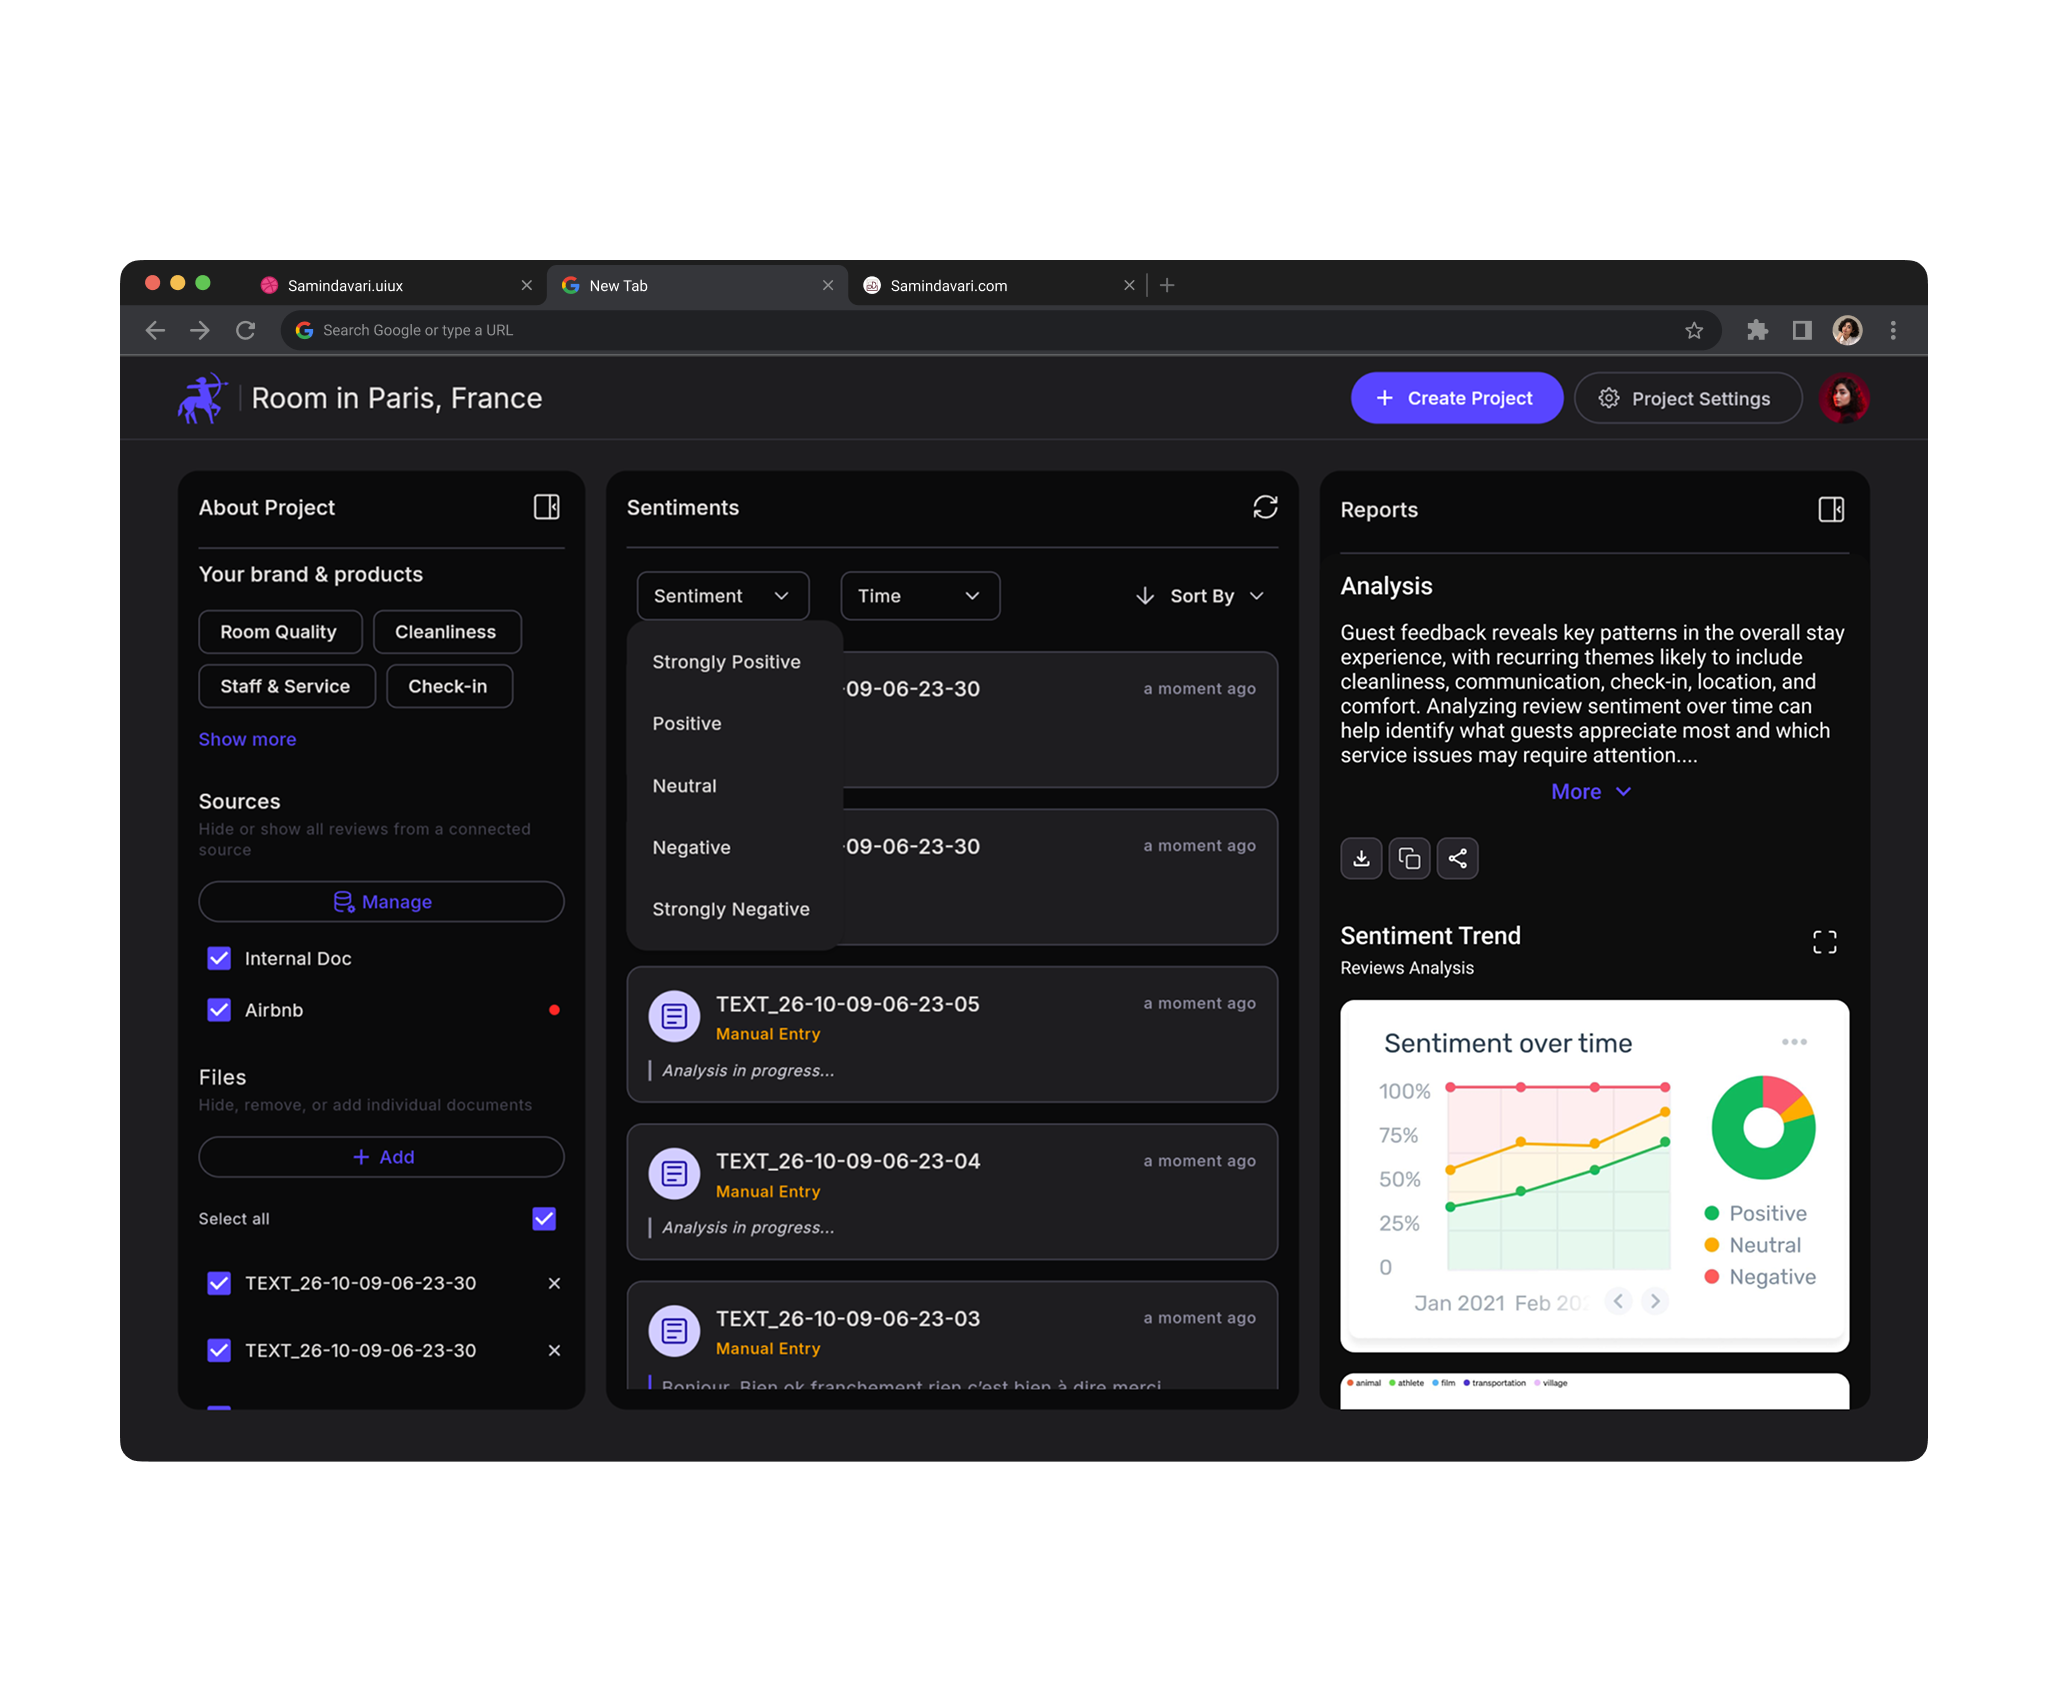
The project workspace is a 3-column layout designed to keep input, analysis and output visible at the same time:
About Project (left): tracked entities, connected Sources and uploaded Files, each with checkboxes to include or hide data.
Sentiments (center): the live feed of analyzed inputs with Sentiment, Time and Sort By filters.
Reports (right): analytics cards, narrative summary and report status.
Design intent:
the user never has to leave the page to understand what data produced which result.
Data Ingestion
+ Add under Files opens the Add your source modal.
Three input paths in one place: drag-and-drop upload (TXT, JSON, CSV, PDF, multiple files at once), Add your text manually, or Add from Sentor Drive.
Staged files show name, size and a remove action before anything is submitted. Add stays disabled until there is something to add.
On submit, the modal closes and the new file appears in the Files list immediately.
Design intent:
the user never has to leave the page to understand what data produced which result.
AI Processing States
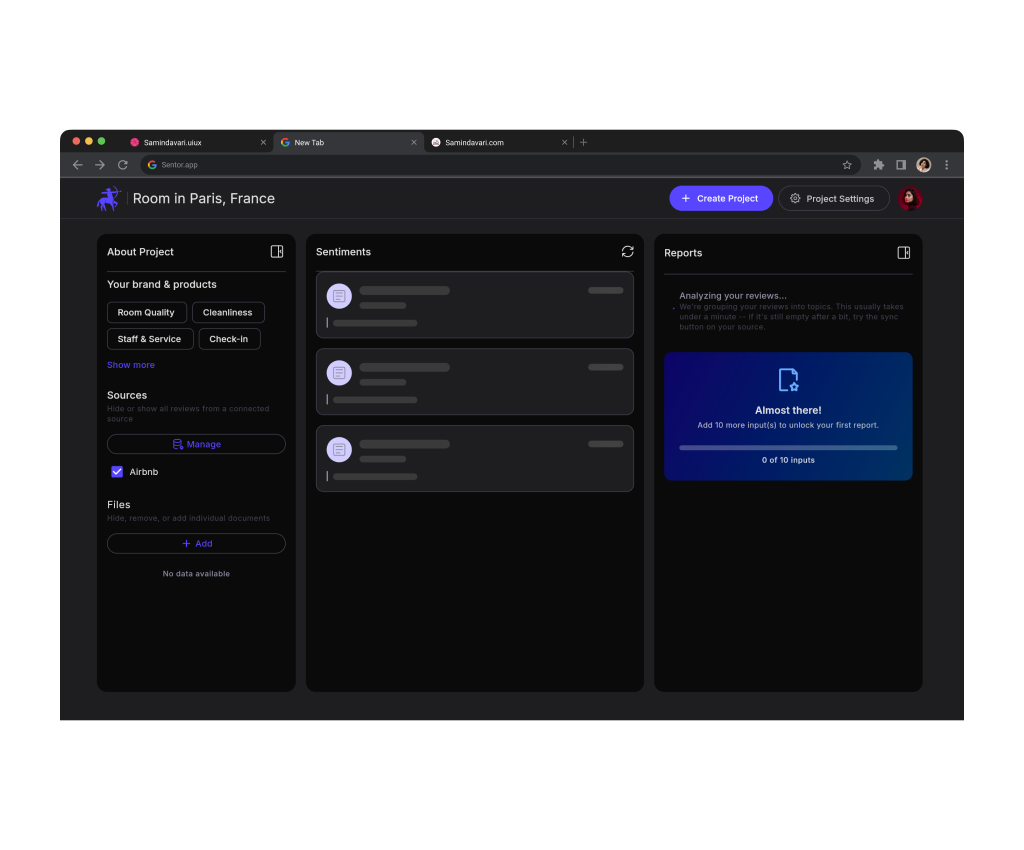
Analysis is asynchronous, so waiting had to be designed, not just tolerated.
Skeleton cards hold the layout while the workspace loads.
A banner states exactly what is happening: still analyzing 4 items, results appear automatically.
Each card carries its own Analysis in progress state, source name and timestamp.
Completed cards unlock sentiment filtering and the analytics views.
Insight Exploration
Sentiment filter: a 5-point scale from Strongly Positive to Strongly Negative.
Sentiment over time: a trend line of Positive, Neutral and Negative share by month, paired with a donut chart for the overall distribution.
Topic clusters: a 3D scatter plot that groups feedback by category in vector space.
Analysis summary: a narrative paragraph that translates charts into plain-language themes, with Sentiment Trend and Reviews Analysis tabs.
Design intent:
layer the insight, from a glanceable distribution to trends, to clusters, to a written explanation, so each user can stop at the depth they need.
Plan Limits & Upgrade Moments
On the Free plan, limits appear exactly where the user meets them, not hidden in billing:
Usage meters on the dashboard (projects, reports, API calls per minute, day and month).
A progress card on reports: add 10 more inputs to unlock your first report.
A contextual toast when manual sync isn't available, with a direct Upgrade action.
A cooldown tooltip on refresh (wait 5s before refreshing again).
Settings, Drive & Developer Access
A single settings area with a persistent sidebar: Account, API Access, Billing & Subscription, Sentor Drive, Notifications, Support & Feedback.
API Access: masked API key with copy and reveal, live rate-limit usage, and a developer resource grid (Swagger docs, Postman setup, Python & TypeScript SDKs, MCP manifest, white-label guides).
Project Settings: separate tabs for General (rename, archive, delete), Importers (sync status, toggle, refresh) and About Project (read-only metadata and entities).
Sentor Drive: account-level file storage, reused across projects.
The Problem
In Sentor, every file added to a project feeds the analysis. When users wanted to remove a file's influence on their results, for example an outdated export or a test file, the only clear option was to delete it.
That created two behaviors that hurt both the user and the data:
Destructive workarounds:
users deleted files they still wanted to keep, just to get them out of the analysis.
Duplicate uploads:
when they later needed the same data again, they re-uploaded it, creating duplicate files and inflating results with repeated inputs.
The Insight
Users weren't trying to delete data. They were trying to shape their dataset.
Storage and analysis are two different intentions, and the interface had merged them into one destructive action.
The Decision
I separated where a file lives from whether it is analyzed:
Sentor Drive became the single, account-level home for files:
1- Upload once
2- Reuse across projects
Inside each project, every file & source got an include/exclude checkbox (hide, remove, or add individual documents), with a Select all control for bulk changes.
Add from Sentor Drive inside the Add your source modal lets users bring an existing file into a project instead of uploading it again.
Delete remains available, but as a deliberate, separate action rather than the only way to change the analysis.
Mistake
Re-upload became Exclude
Keep
Re-include
UI System &
Design Highlights
01
Dark, Data-First Interface A high-contrast dark palette keeps charts and sentiment colors readable, with a single violet accent reserved for primary actions and active states.
02
Consistent Sentiment Color Language Green, yellow and red mean the same thing in feed tags, trend lines, the donut chart and legends, so users read results without re-learning each view.
03
Designed System States Empty states with a clear next action, skeleton loaders, per-item processing states, disabled actions with visible reasons, cooldown tooltips and contextual upgrade toasts. Every waiting or limited moment explains itself.
04
Focused Modals Over Page Switches Adding sources happens in a modal over the workspace, so users keep their project context while bringing in new data.
05
Progressive Depth The dashboard shows usage and projects; the workspace shows data and results; settings hold configuration. Complexity appears only at the level where it's needed.
Key Outcomes & Value
The core outcome of Sentor was not simply visualizing sentiment. It was creating a product system that connects SOURCES / DATA CONTROL / AI ANALYSIS / INSIGHTS / API into one continuous experience.
1. Project setup was broken into three focused steps, with entity definition made explicit from the start.
2. Asynchronous AI processing became visible and predictable through designed loading and progress states.
3. Insights were layered from a sentiment distribution to trends, topic clusters and a written summary.
4. Users gained non-destructive control over what feeds their analysis.